Client 장비에 network port가 여러개 있는 경우, 특정 network port를 지정하여 IP 패킷을 전송하고 싶을 때가 있다.
이럴 때, source IP address를 binding하면 특정 network port를 통해 IP 패킷이 전송된다.
참고: 일반적으로 Target IP address로 가기 위한 routing path 및 network port는 OS에 있는 Routing table을 통해서 자동으로 결정된다. 그러나 Target IP address로 가기 위한 routing path가 1개가 아닌 2개 이상인 경우에는 어느 network port를 통해서 IP 패킷이 나갈지 예측하기 어렵다.
package main

import (
    "fmt"
    "io/ioutil"
    "net"
    "net/http"
    "time"
)


func main() {
##
## NOTE:  14.33.80.179를 Source IP address로 지정한다. (즉, Source IP address binding)
##
    localAddr, err := net.ResolveIPAddr("ip", "14.33.80.179")
    if err != nil {
        panic(err)
    }

    localTCPAddr := net.TCPAddr{
        IP: localAddr.IP,
    }

    d := net.Dialer{
        LocalAddr: &localTCPAddr,
        Timeout:   30 * time.Second,
        KeepAlive: 30 * time.Second,
    }

    tr := &http.Transport{
        Proxy:               http.ProxyFromEnvironment,
        Dial:                d.Dial,
        TLSHandshakeTimeout: 10 * time.Second,
    }

    webclient := &http.Client{Transport: tr}

    // Use NewRequest so we can change the UserAgent string in the header
    req, err := http.NewRequest("GET", "https://www.naver.com", nil)
    if err != nil {
        panic(err)
    }

    res, err := webclient.Do(req)
    if err != nil {
        panic(err)
    }

    fmt.Println("DEBUG", res)
    defer res.Body.Close()

    content, err := ioutil.ReadAll(res.Body)
    if err != nil {
        panic(err)
    }
    fmt.Printf("%s", string(content))
}
##
## Prometheus 서버 설치 파일을 다운로드
##

$ wget https://github.com/prometheus/prometheus/releases/download/v2.45.0-rc.0/prometheus-2.45.0-rc.0.linux-amd64.tar.gz

##
## 압축 풀기
##

$ tar xf prometheus-2.45.0-rc.0.linux-amd64.tar.gz

$ cd prometheus-2.45.0-rc.0.linux-amd64

##
## 설정 파일 수정하기
##

$ cat prometheus.yml

# my global config
global:
  scrape_interval: 15s # Set the scrape interval to every 15 seconds. Default is every 1 minute.
  evaluation_interval: 15s # Evaluate rules every 15 seconds. The default is every 1 minute.
  # scrape_timeout is set to the global default (10s).

# Alertmanager configuration
alerting:
  alertmanagers:
    - static_configs:
        - targets:
          # - alertmanager:9093

# Load rules once and periodically evaluate them according to the global 'evaluation_interval'.
rule_files:
  # - "first_rules.yml"
  # - "second_rules.yml"

# A scrape configuration containing exactly one endpoint to scrape:
# Here it's Prometheus itself.
scrape_configs:
  # The job name is added as a label `job=<job_name>` to any timeseries scraped from this config.
  - job_name: "prometheus"

    # metrics_path defaults to '/metrics'
    # scheme defaults to 'http'.

    # 나는 아래 부분을 수정했다.
    # 10.1.4.56:8080은 Python으로 작성한 Exporter의 접속점이다.
    static_configs:
      - targets: ["10.1.4.56:8000", "10.1.3.241:9090"]

##
## Prometheus 서버 구동하기
##

$ ./prometheus --config.file="./prometheus.yml" &
... 중간 생략 ...
ts=2023-06-13T08:24:54.837Z caller=main.go:1004 level=info msg="Server is ready to receive web requests."
ts=2023-06-13T08:24:54.837Z caller=manager.go:995 level=info component="rule manager" msg="Starting rule manager..."
Prometheus Client 예제 작성
테스트용 Metric data를 만들기 위해서 아래와 같이Example code를 작성한다.
from prometheus_client import start_http_server, Summary
from prometheus_client import Counter
import random
import time


# Create a metric to track time spent and requests made.
REQUEST_TIME = Summary('request_processing_seconds', 'Time spent processing request')

# Decorate function with metric.
@REQUEST_TIME.time()
def process_request(t):
    """A dummy function that takes some time."""
    time.sleep(t)


if __name__ == '__main__':
    # Start up the server to expose the metrics.
    start_http_server(8000)

    c = Counter('sejong_packet_bytes', 'http request failure', ['src_ip', 'dst_ip', 'src_port', 'dst_port'])
    # Generate some requests.
    while True:
        process_request(random.random()/10)
        c.labels(src_ip='10.1.4.11', dst_ip='192.168.5.22', src_port='11111', dst_port='').inc(1322)
        c.labels(src_ip='10.1.8.33', dst_ip='192.168.9.66', src_port='12345', dst_port='23456').inc(1500)
        c.labels(src_ip='172.16.8.33', dst_ip='192.168.9.66', src_port='12345', dst_port='23456').inc(1500)
        c.labels(src_ip='172.17.7.33', dst_ip='192.168.33.66', src_port='80808', dst_port='90909').inc(1500)
##########################################################
## Client Linux OS에서 아래의 명령을 수행
##########################################################

##########################################################
## pptp 관련 패키지를 설치한다.
##########################################################
$  sudo apt install pptp-linux


##########################################################
## /etc/ppp/options 파일을 편집한다.
##########################################################
$  cat  /etc/ppp/options

lock
noauth
nobsdcomp
nodeflate
refuse-pap
refuse-eap
refuse-chap
refuse-mschap
mtu 1400

$

##########################################################
## /etc/ppp/chap-secrets 파일을 편집한다.
##########################################################
$  cat  /etc/ppp/chap-secrets

sejong  PPTP  "my-password" *

$

##########################################################
##  /etc/ppp/peers/sejong 파일을 편집한다.
##########################################################
$  cat  /etc/ppp/peers/sejong

pty "pptp 55.123.12.123 --nolaunchpppd"
name sejong
remotename PPTP
file /etc/ppp/options
ipparam sejong


##########################################################
## << 참고:  이 작업은 필요한 경우만 할 것 !!! >>
##
## 이 내용은 꼭 필요한 것은 아닌데, ppp0 tunnel port가 생성되고 IP address가 설정되고 나서
## static routing table에 추가하고 싶은 내용이 있다면,
## 아래와 같이 ip-up 파일에 route 명령을 추가한다.
## (이렇게 하는 것이 정석적 방법인지는 모르겠다.  일단, 나는 이렇게 사용하고 있다.)
##########################################################
$  cat  /etc/ppp/ip-up

... (중간 생략) ...
ip route add 192.168.0.0/24 dev ppp0    # <-- 나는 이 내용을 추가했다.

$


##########################################################
## 이제 설정 작업은 모두 끝났다. pon 명령을 실행하면 잘 동작할 것이다. ^^
##########################################################

##########################################################
## 위에서 설정한 파일을 이용하여 PPTP 서버와 GRE 터널을 만든다.
## 참고로 pon 명령은 "ppp on"을 줄인 말이다.
##########################################################
$  pon  sejong  debug  dump  logfd 2  nodetach

...
...
local  IP address 192.168.0.220
remote IP address 192.168.0.1
Script /etc/ppp/ip-up started (pid 14290)
Script /etc/ppp/ip-up finished (pid 14290), status = 0x0
참고로, 위 pon 명령을 수행하면 명령행 prompt가 출력되지 않는다. 왜냐하면 pon 명령이 백그라운드로 동작하는 것이 아니기 때문에 pod 명령을 수행한 터미널은 이 상태로 두고, 다른 터미널을 하나 더 열어서 작업해야 한다. 새 터미널에서 아래와 같이 VPN 서버 쪽으로 ping을 보내본다.
$  ping 192.168.0.1

ing 192.168.0.1 -c 1
PING 192.168.0.1 (192.168.0.1) 56(84) bytes of data.
64 bytes from 192.168.0.1: icmp_seq=1 ttl=64 time=4.45 ms

--- 192.168.0.1 ping statistics ---
1 packets transmitted, 1 received, 0% packet loss, time 0ms
rtt min/avg/max/mdev = 4.448/4.448/4.448/0.000 ms

$
##
## Elasticsearch 기동하기
##

$  bin/elasticsearch


##
## Kibana 기동하기
##   주의: 명령 옵션으로 --host를 지정하지 않으면, 기본값이 127.0.0.1로 설정된다.
##        만약 Web Browser가 kibana 서버와 다른 곳에 있다면 반드시 아래와 같이
##        외부에서 접근 가능한 서버 주소를 지정해주어야 한다.

$ bin/kibana  --host=192.168.0.11
Elasticsearch 서버와 Kibana 서버를 설치했으면, 아래의 문서를 보면서 Python Example App을 작성한다.
Elasticsearch Python Client Example
2022년 11월 현재, 아래의 Web Docs가 가장 쉽게 설명된 것 같다.
Python PKG 설치, 인증/연결, 설정, Client Example Code 등 필요한 내용을 다 포함하고 있다.
그냥 Copy & Paste해서 `python3 myexample.py` 명령을 수행하면 된다.
Document 1개를 Elasticsearch에 저장하는 예제
from datetime import datetime
from elasticsearch import Elasticsearch

##
## NOTE : Configuration for multi node
##
NODES = [ "https://10.1.3.166:9200" ]

##
## Password for the 'elastic' user generated by Elasticsearch
##
ELASTIC_PASSWORD = "mypasswd"

##
## Create the client instance
##
es = Elasticsearch(
    NODES,
    ca_certs="/MyWorkSpace/elastic-stack-metal-install/elasticsearch-8.5.1/config/certs/http_ca.crt",
    basic_auth=("elastic", ELASTIC_PASSWORD)
)

## Create documents
doc = {
    'my-key-example-a': 'my-value-1',
    'my-key-example-b': 'my-value-2',
    'date': datetime.now(),
    'msg': "my log message example... hello~  world ^^",
}

resp = es.index(index="example-index-0", id=0, document=doc)
print(resp['result'])
Bulk로 많은 Document를 Elasticsearch에 저장하는 예제
from datetime import datetime
from elasticsearch import Elasticsearch
from randmac import RandMac


NODES = [ "https://10.1.3.166:9200" ]

##
## Password for the 'elastic' user generated by Elasticsearch
##
ELASTIC_PASSWORD = "mypasswd"

##
## Create the client instance
##
es = Elasticsearch(
    NODES,
    ca_certs="/MyWorkSpace/elastic-stack-metal-install/elasticsearch-8.5.1/config/certs/http_ca.crt",
    basic_auth=("elastic", ELASTIC_PASSWORD)
)

doc_id = 0
loop_cnt = 0

##
## Create documents
##
##   참고: 아래 for 문은 document 예시를 그럴듯하게 만들기 위함이다.
##        실제 Elasticsearch와는 아무런 관련이 없다. ^^
ip_networks = ["10", "172", "192"]

for ii in ip_networks:
    for xx in range(254):
        for yy in range(254):
            for zz in range(254):
                macaddress = str(RandMac())
                doc = {
                    'app': 'nac-server',
                    'level': 'info',
                    'date': datetime.now(),
                    'ip-address': ii + '.' + str(xx) + '.' +  str(yy) + '.' + str(zz),
                    'mac-address': macaddress,
                    'msg': 'Device ' + macaddress + ' is started',
                }

                doc_id += 1
                loop_cnt += 1
                resp = es.index(index="example-index-0", id=doc_id, document=doc)
            print("Count: " + str(loop_cnt) + "   " + str(resp['_index']) + "   " + str(resp['_id']) + "   " + str(resp['result']) + "   shard:" + str(resp['_shards']) + "   " + str(resp['_seq_no']))

print("\nTotal Document: " + str(doc_id))
Document를 조회하기
from datetime import datetime
from elasticsearch import Elasticsearch

NODES = [ "https://10.1.3.166:9200" ]

# Password for the 'elastic' user generated by Elasticsearch
ELASTIC_PASSWORD = "mypasswd"

# Create the client instance
es = Elasticsearch(
    NODES,
    ca_certs="/MyWorkSpace/elastic-stack-metal-install/elasticsearch-8.5.1/config/certs/http_ca.crt",
    basic_auth=("elastic", ELASTIC_PASSWORD)
)

resp = es.get(index="test-index", id=5)
print(resp)
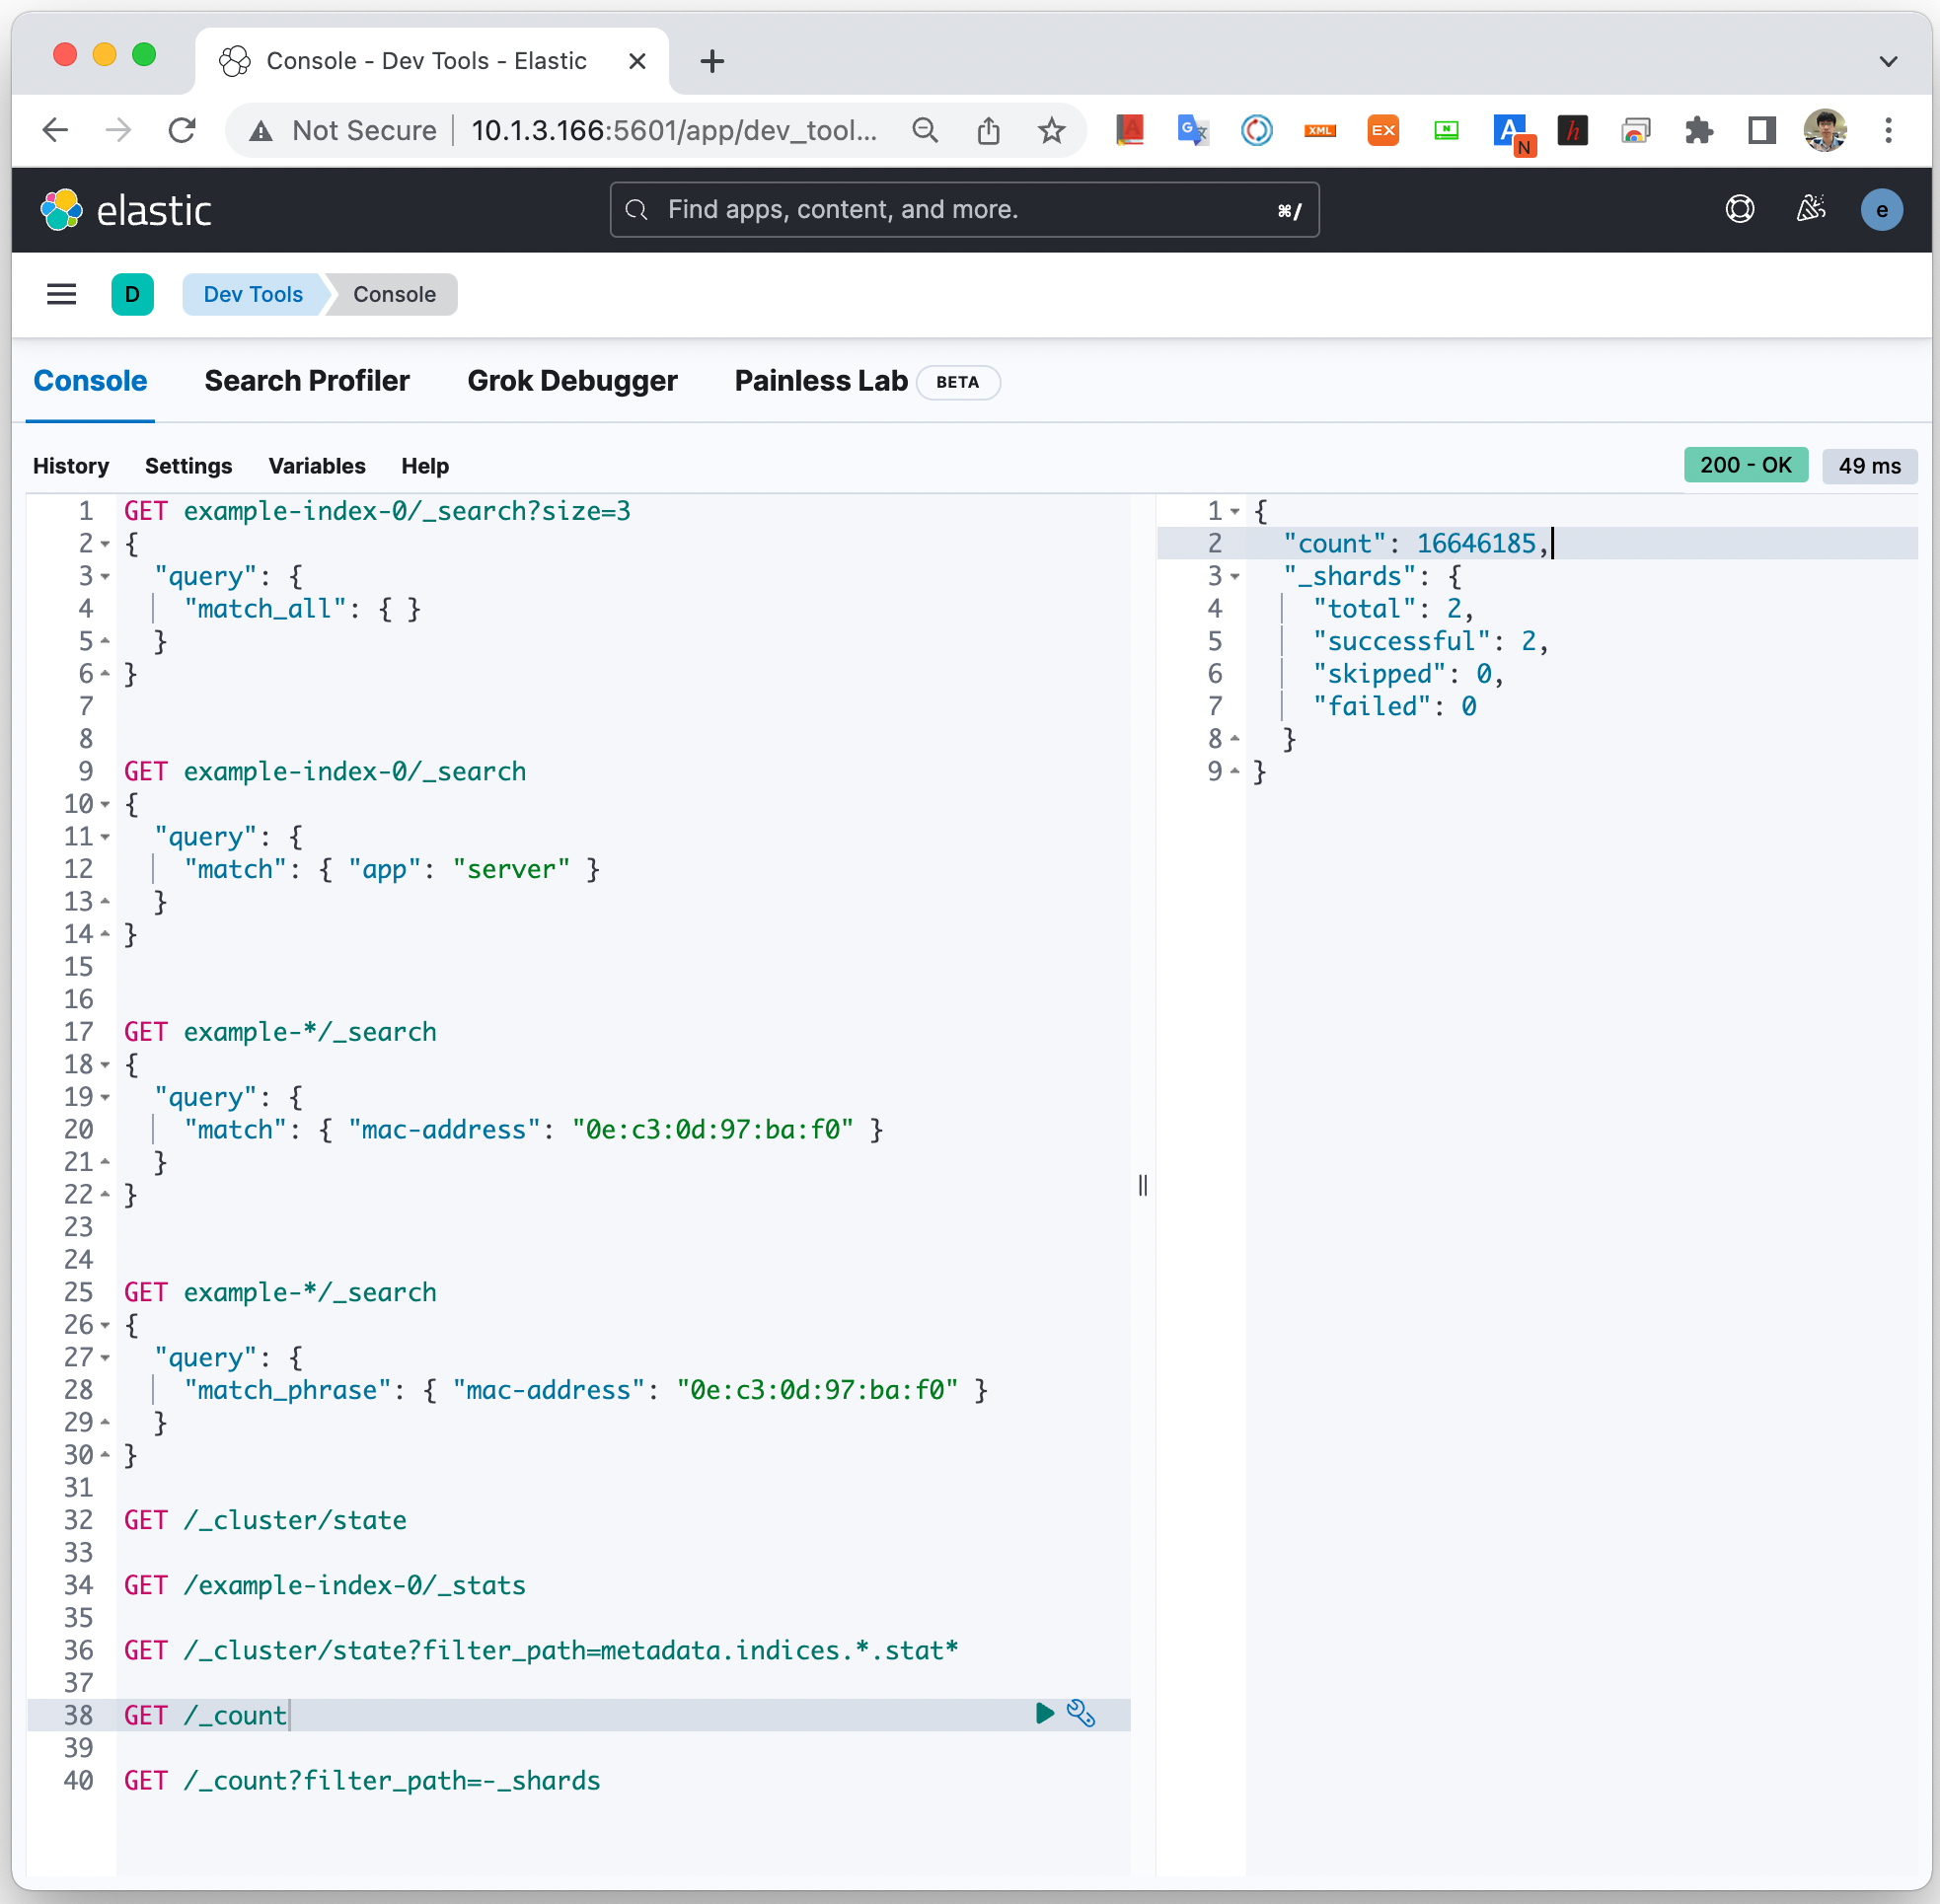
Kibana Web GUI로 결과 확인하기
Kibana Web GUI의 'dev tool'을 이용하여 아래와 같이 index, document를 조회할 수 있다.
Kibana Web UI
위 Web GUI에서 사용했던 Elasticsearch Query 참고.
##
## Index 정보를 가져온다.
##

GET _cat/indices?v

## 응답은 이런 모양이다.
health status index           uuid                   pri rep docs.count docs.deleted store.size pri.store.size
yellow open   example-index-0 Up1jqY3PTG2pLHdOLJcLGQ   1   1   18126912          739      2.9gb          2.9gb
yellow open   test-index      nGaLdNNORHKfJF1maBlNvw   1   1          2            0     11.2kb         11.2kb


##
## "example-index-0" 인덱스에 있는 모든 document 중에서 3개만 가져온다.
##

GET example-index-0/_search?size=3
{
  "query": {
    "match_all": { }
  }
}


##
## "app" 항목 중에서 "server"라는 어휘가 포함돠ㅣㄴ 문서를 모두 가져온다.
##

GET example-index-0/_search
{
  "query": {
    "match": { "app": "server" }
  }
}


##
## "mac-address" 항목 중에서 정확하게 "0e:c3:0d:97:ba:f0" 와 일치하는 document만 가져온다.
##

GET example-*/_search
{
  "query": {
    "match_phrase": { "mac-address": "0e:c3:0d:97:ba:f0" }
  }
}


##
## Elasticsearch Cluster 상태 정보를 가져온다.
##

GET /_cluster/state

GET /_cluster/state?filter_path=metadata.indices.*.stat*

GET /example-index-0/_stats


##
## Elasticsearch Cluster에 저장된 전체 Document 개수를 가져온다.
##

GET /_count


##
## 위 _count 정보 중에서 _shard 정보를 제외한 정보를 가져온다.
##

GET /_count?filter_path=-_shards
Netcat(nc)은TCP,UDP를 통해 Peer(Client/Server) 연결하고, 데이터를 읽고 쓰는 유틸리티 프로그램이다.
대부분 개발자, 운영자가 아래와 같은 목적으로 NC 명령을 사용할 것이다.
1) 두 장비(Network Node) 간에 IP Network이 정상인지 확인하거나
2) 중간에 방화벽이 있다면, 방화벽 정책이 적용되었는지 직접 TCP, UDP 트래픽을 테스트하기 위해서 NC를 사용한다.
3) 서버 또는 클라이언트 한쪽만 개발(구현)한 뒤에 Peer를 시뮬레이션하기 위해서... (즉, 시뮬레이터 만들기 귀찮아서 ㅋㅋ)
설치
##
## Mac OS 에 설치하는 경우
##

$  brew install netcat


##
## Ubuntu 에 설치하는 경우
##

$  apt install -y netcat


##
## CentOS, Redhat 에 설치하는 경우
##

$  yum install -y nc
사용 방법 / 예제
장황하게 설명하는 것보다는 아래 화면 캡처 하나가 훨씬 이해하기 좋을 듯~~~
그냥 아래 화면처럼 따라하면 테스트가 잘 된다.
##
## Netcat Server
##

$  nc  -l  -p 9090


##
## Netcat Client
##

$  nc  10.10.5.3  9090

이것은 테스트 메시지이다. (enter key)
...
...
... 이런 식으로 메시지를 타이핑하면서 테스트한다 ...
...
...

^C

$