반응형
테스트 및 블로그 작성한 날짜: 2023년 6월 13일
Prometheus 설치
아래 Web page에서 내 운영 환경에 맞는 파일을 다운로드한다.
https://prometheus.io/download/
아래와 같이 명령을 따라 수행하여 Prometheus 서버를 구동한다.
##
## Prometheus 서버 설치 파일을 다운로드
##

$ wget https://github.com/prometheus/prometheus/releases/download/v2.45.0-rc.0/prometheus-2.45.0-rc.0.linux-amd64.tar.gz

##
## 압축 풀기
##

$ tar xf prometheus-2.45.0-rc.0.linux-amd64.tar.gz

$ cd prometheus-2.45.0-rc.0.linux-amd64

##
## 설정 파일 수정하기
##

$ cat prometheus.yml

# my global config
global:
  scrape_interval: 15s # Set the scrape interval to every 15 seconds. Default is every 1 minute.
  evaluation_interval: 15s # Evaluate rules every 15 seconds. The default is every 1 minute.
  # scrape_timeout is set to the global default (10s).

# Alertmanager configuration
alerting:
  alertmanagers:
    - static_configs:
        - targets:
          # - alertmanager:9093

# Load rules once and periodically evaluate them according to the global 'evaluation_interval'.
rule_files:
  # - "first_rules.yml"
  # - "second_rules.yml"

# A scrape configuration containing exactly one endpoint to scrape:
# Here it's Prometheus itself.
scrape_configs:
  # The job name is added as a label `job=<job_name>` to any timeseries scraped from this config.
  - job_name: "prometheus"

    # metrics_path defaults to '/metrics'
    # scheme defaults to 'http'.

    # 나는 아래 부분을 수정했다.
    # 10.1.4.56:8080은 Python으로 작성한 Exporter의 접속점이다.
    static_configs:
      - targets: ["10.1.4.56:8000", "10.1.3.241:9090"]

##
## Prometheus 서버 구동하기
##

$ ./prometheus --config.file="./prometheus.yml" &
... 중간 생략 ...
ts=2023-06-13T08:24:54.837Z caller=main.go:1004 level=info msg="Server is ready to receive web requests."
ts=2023-06-13T08:24:54.837Z caller=manager.go:995 level=info component="rule manager" msg="Starting rule manager..."
Prometheus Client 예제 작성
테스트용 Metric data를 만들기 위해서 아래와 같이 Example code를 작성한다.
from prometheus_client import start_http_server, Summary
from prometheus_client import Counter
import random
import time


# Create a metric to track time spent and requests made.
REQUEST_TIME = Summary('request_processing_seconds', 'Time spent processing request')

# Decorate function with metric.
@REQUEST_TIME.time()
def process_request(t):
    """A dummy function that takes some time."""
    time.sleep(t)


if __name__ == '__main__':
    # Start up the server to expose the metrics.
    start_http_server(8000)

    c = Counter('sejong_packet_bytes', 'http request failure', ['src_ip', 'dst_ip', 'src_port', 'dst_port'])
    # Generate some requests.
    while True:
        process_request(random.random()/10)
        c.labels(src_ip='10.1.4.11', dst_ip='192.168.5.22', src_port='11111', dst_port='').inc(1322)
        c.labels(src_ip='10.1.8.33', dst_ip='192.168.9.66', src_port='12345', dst_port='23456').inc(1500)
        c.labels(src_ip='172.16.8.33', dst_ip='192.168.9.66', src_port='12345', dst_port='23456').inc(1500)
        c.labels(src_ip='172.17.7.33', dst_ip='192.168.33.66', src_port='80808', dst_port='90909').inc(1500)
위에서 작성한 example code를 실행한다.
$ pip install prometheus-client

$ python3 my_example.py
좀 더 다양한 Python example code를 보려면, GitHub 저장소를 볼 것!
https://github.com/prometheus/client_python
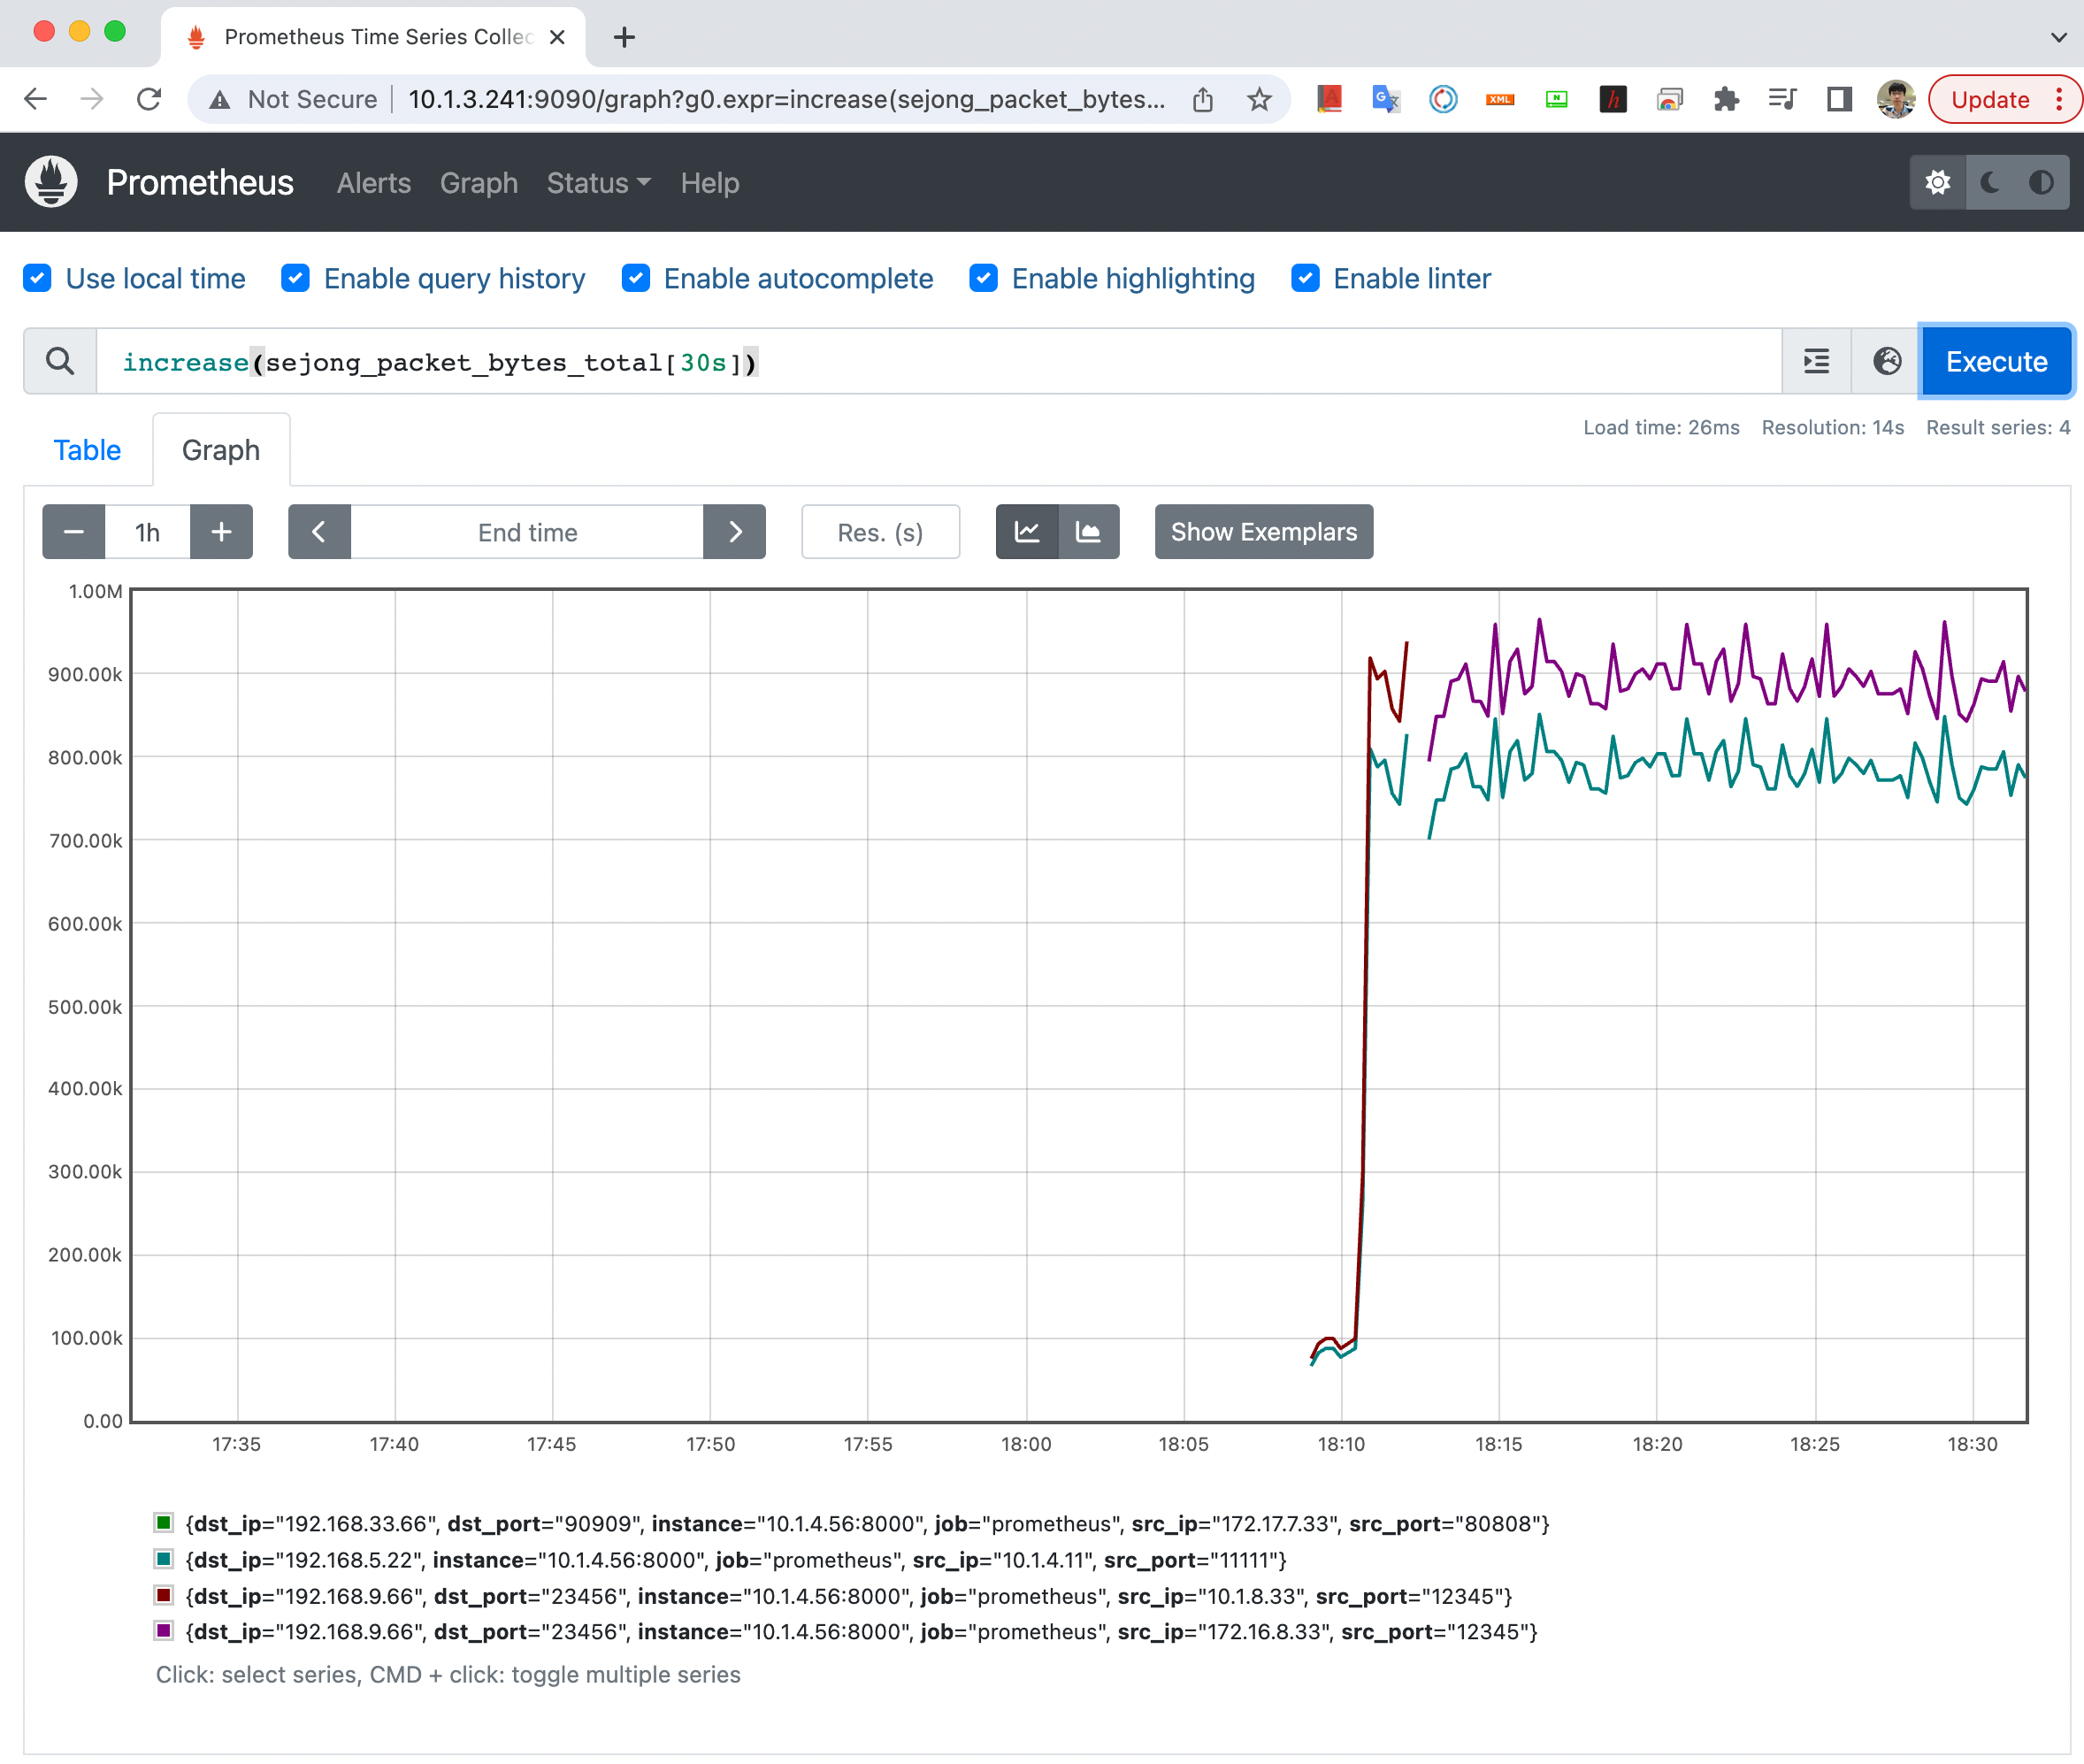
Web UI에서 Metric 확인
Query 입력하는 공간에 "increase(sejong_packet_bytes_total[30s])" 를 입력한다.
블로그 작성자: sejong.jeonjo@gmail.com
'Python' 카테고리의 다른 글
| 주기적 화면 캡처 및 OCR 적용된 PDF 파일로 변환 (나만의 eBook 만들기) (0) | 2025.01.12 |
|---|---|
| Python 온라인 자습서(Tutorial), Reference, Howto, API 문서 (0) | 2024.03.27 |
| Python Log Class 및 예제 (0) | 2024.03.26 |
| Bind9 Zone 파일의 Serial 변경하는 Python Script, Bash Script (0) | 2024.03.25 |
| YAML, JSON 파일 내용 비교 (변경 내역 비교) (0) | 2021.11.18 |