나는 Spirent, Ixia 같은 성능 계측기 회사의 계측 장비를 빌려서 성능 측정을 해오고 있었는데, 공신력을 따지는 성능 측정 보고서가 필요한 경우가 아니라면, Open source code로 구현된 계측기도 쓸만할 것 같다는 생각이 들었다. 그래서 이것저것 찾아보다가 CISCO TRex 프로젝트가 눈에 들어왔다.
Cisco TRex 간단하게 살펴보기
- Intel DPDK를 사용
주의: Poll Mode로 NIC에 있는 Data를 Fetch하기 때문에 특정 CPU Core 자원을 100% 다 사용한다.
이런 이유로 TRex가 전용으로 사용할 CPU Core가 별도로 있어야 한다.
- Stateful 통신(예: TCP HTTP HTTPS DNS 등 Request & Response 방식), Stateless 통신(예: 단방향 UDP 통신) 모두 지원 - Open source - TRex를 사용하면 개발자는 다양한 유형의 트래픽을 생성하고 결과로 수신되는 데이터를 분석 - 데이터 분석은 MAC 및 IP 수준에서 수행 (Network Layer 2~3를 처리하는 DUT에 대한 성능 측정이 목적이다.) - DUT는 L3 Switch(IP Router) 또는 L4 이상의 IP network 처리 장치라고 가정 - Linux 환경에서 작동 (나는 Ubuntu 22.04에서 테스트했음)
TRex 설치 및 테스트 환경 구성
TRex와 DUT로 사용할 Linux 장비 구축
OS & HW:
- OS: Ubuntu 22.04
- Intel(R) Xeon(R) CPU E5-2640 v3 @ 2.60GHz (16 cores)
- Memory 128GB
TRex 설치 파일을 Download
$  mkdir -p  /opt/trex
$  cd  /opt/trex
$  wget  --no-check-certificate  https://trex-tgn.cisco.com/trex/release/v3.06.tar.gz
$  tar -xfz  v3.06.tar.gz
$  ls -F
 v3.06/
$  cd  v3.06
주의: 아래 웹 페이지에서 TRex 최신 버전을 확인하고 다운로드하기. https://trex-tgn.cisco.com/trex/release/
TRex가 사용할 NIC 설정
테스트 네트워크는 아래 그림과 같다.
2개의 Linux 장비 중에서 왼쪽 장비는 TRex를 설치하고, 오른쪽 장비는 DUT로 사용할 것이다.
DUT는 Linux에 static ip routing을 설정하여 간단한 Router 동작만 하게 할 것이다.
아래 예시처럼 똑같이 따라하면 된다.
$  ./dpdk_setup_ports.py -i

By default, IP based configuration file will be created. Do you want to use MAC based config? (y/N) N
+----+------+---------+-------------------+------------------------------------------------+-----------------+----------+----------+
| ID | NUMA |   PCI   |        MAC        |                      Name                      |     Driver      | Linux IF |  Active  |
+====+======+=========+===================+================================================+=================+==========+==========+
| 0  | 0    | 03:00.0 | 08:33:73:01:6b:98 | 82580 Gigabit Network Connection               | igb             | eth2     |          |
+----+------+---------+-------------------+------------------------------------------------+-----------------+----------+----------+
| 1  | 0    | 03:00.1 | 08:33:73:01:6b:99 | 82580 Gigabit Network Connection               | igb             | eth3     |          |
+----+------+---------+-------------------+------------------------------------------------+-----------------+----------+----------+
...
... 중간 생략 ...
...
+----+------+---------+-------------------+------------------------------------------------+-----------------+----------+----------+
| 14 | 1    | 88:00.0 | 08:33:73:08:3b:2a | 82599ES 10-Gigabit SFI/SFP+ Network Connection | uio_pci_generic |          |          |
+----+------+---------+-------------------+------------------------------------------------+-----------------+----------+----------+
| 15 | 1    | 88:00.1 | 08:33:73:08:3b:2b | 82599ES 10-Gigabit SFI/SFP+ Network Connection | uio_pci_generic |          |          |
+----+------+---------+-------------------+------------------------------------------------+-----------------+----------+----------+
| 16 | 1    | 8a:00.0 | 08:33:73:08:3b:2c | 82599ES 10-Gigabit SFI/SFP+ Network Connection | ixgbe           | eth16    |          |
+----+------+---------+-------------------+------------------------------------------------+-----------------+----------+----------+
| 17 | 1    | 8a:00.1 | 08:33:73:08:3b:2d | 82599ES 10-Gigabit SFI/SFP+ Network Connection | ixgbe           | eth17    |          |
+----+------+---------+-------------------+------------------------------------------------+-----------------+----------+----------+
Please choose an even number of interfaces from the list above, either by ID, PCI or Linux IF
Stateful will use order of interfaces: Client1 Server1 Client2 Server2 etc. for flows.
Stateless can be in any order.
For performance, try to choose each pair of interfaces to be on the same NUMA.
Enter list of interfaces separated by space (for example: 1 3) : 14 15

For interface 14, assuming loopback to its dual interface 15.
Putting IP 1.1.1.1, default gw 2.2.2.2 Change it?(y/N) N
For interface 15, assuming loopback to its dual interface 14.
Putting IP 2.2.2.2, default gw 1.1.1.1 Change it?(y/N) N
Print preview of generated config? (Y/n) Y

... 출력 내용 생략 ...

$  vi /etc/trex_cfg.yaml

### Config file generated by dpdk_setup_ports.py ###

- version: 2
  interfaces: ['88:00.0', '88:00.1']
  port_info:
      - ip: 16.0.0.253                ## 내가 수정한 부분.  TRex client side IP address.
        default_gw: 16.0.0.254        ## 내가 수정한 부분.  DUT IP address.
      - ip: 48.0.0.253                ## 내가 수정한 부분.  TRex server side IP address.
        default_gw: 48.0.0.254        ## 내가 수정한 부분.  DUT IP address.

  platform:
      master_thread_id: 0
      latency_thread_id: 1
      dual_if:
        - socket: 1
          threads: [8,9,10,11,12,13,14,15,24,25,26,27,28,29,30,31]

$
위 port_info 항목에서 설정한 network 대역에 대해서 간략하게 설명하면,
- Client host가 사용할 IP address range: 16.0.0.0 ~ 16.0.0.127 (16.0.0.0/25)
- Server host가 사용할 IP address range: 48.0.0.0 ~ 48.0.0.127 (48.0.0.0/25)
- Client host가 사용할 gateway address: 16.0.0.254
- Server host가 사용할 gateway address: 48.0.0.254
DUT 장비에서 설정할 내용
DUT 장비에서 아래와 같이 ip_forward에 관해 설정한다.
##
## Linux OS가 IP packet을 forward할 수 있도록 ip_forward를 enable 시킨다.
##
sysctl -w net.ipv4.ip_forward=1
# or
# echo 1 > /proc/sys/net/ipv4/ip_forward
DUT 장비에서 Network port를 설정한다.
$  vi  /etc/netplan/00-installer-config.yaml

network:
  version: 2
  ethernets:
    eth0:
      addresses:
        - 16.0.0.254/25
      routes:
        - to: 16.0.0.0/25
          via: 16.0.0.253
    eth1:
      addresses:
        - 48.0.0.254/25
      routes:
        - to: 48.0.0.0/25
          via: 48.0.0.253
... 중간 생략 ...

$ netplan apply
위 network 설정에 대한 부연 설명: - TRex의 client 및 server가 emulation하는 IP address(16.0.0.0/25)가 DUT와 동일한 IP network이면 안 된다. - 아마도 TRex를 구현할 때, (IP address + MAC address)를 Mapping하여 Host를 emulation하면 computing cost 및 MAC learning에 대한 load가 커지기 때문에 MAC address를 과감하게 생략하고 L3 switch 뒤에 Host 장치가 있다고 가정하고 TRex를 구현한게 아닌가 싶다. (나의 상상력에 의한 추정)
테스트를 위한 준비 작업은 끝 !!
아래 글은 실제로 TCP, UDP 패킷을 생성하여 성능 테스트 방법이다.
복잡한 입력 내용은 없고, 아래 예제 CLI 명령을 복붙(Copy & Paste)하면 땡 !!
Stateful Networking Test (TCP, HTTP)
TRex로 사용할 Linux 장비에 SSH 터미널을 미리 2개 접속해놓고 사용하는 것이 좋다.
[ Terminal A - TRex 서버 프로그램 구동용 ]
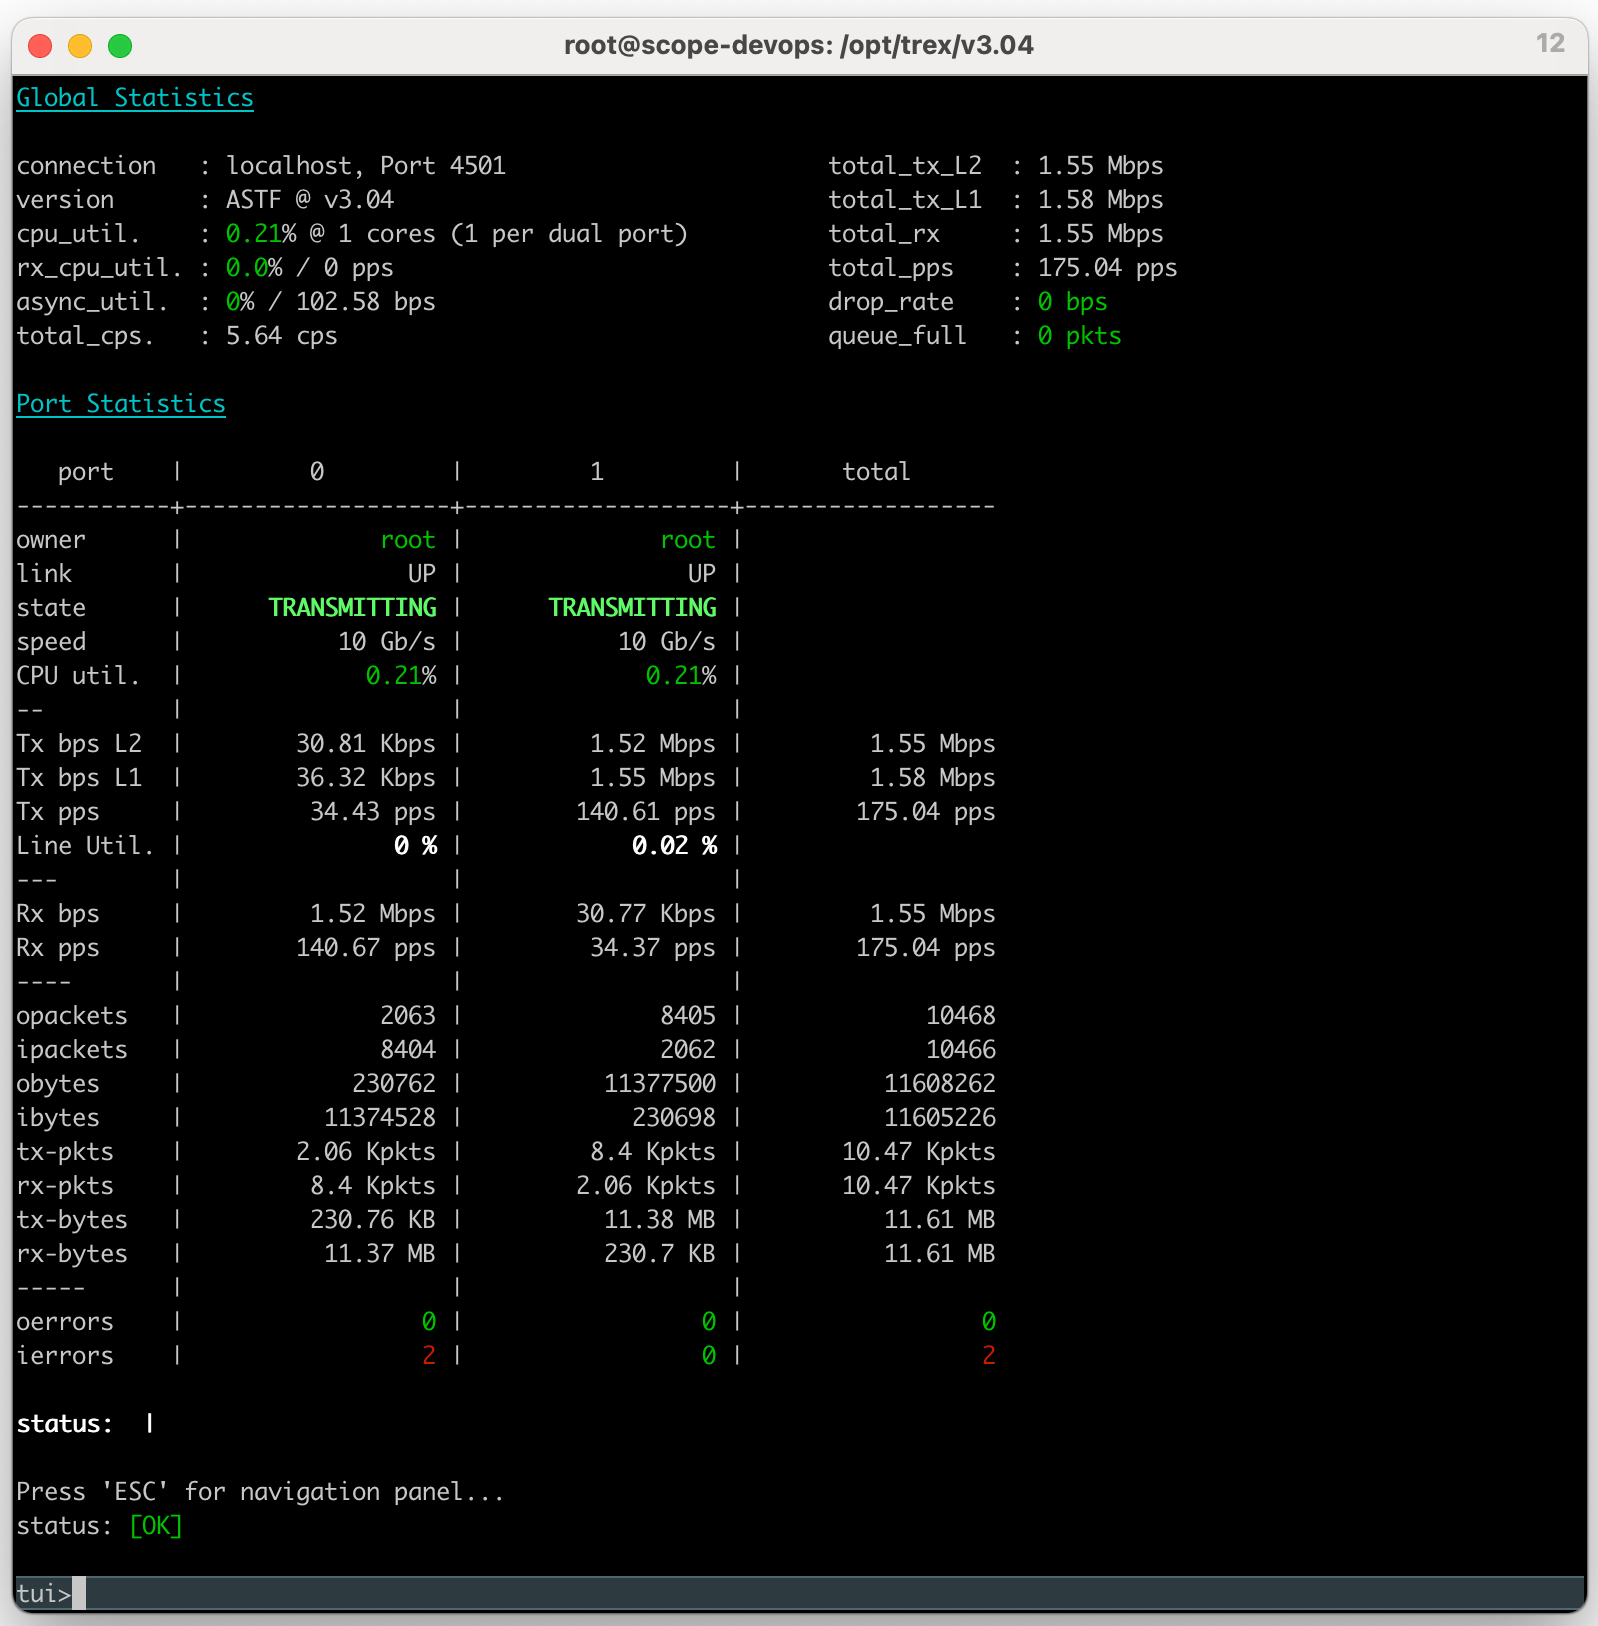
$  ./t-rex-64  -i  --astf

The ports are bound/configured.
Starting  TRex v3.04 please wait  ...
 set driver name net_ixgbe
 driver capability  : TCP_UDP_OFFLOAD  TSO  LRO
 set dpdk queues mode to RSS_DROP_QUE_FILTER
 Number of ports found: 2
zmq publisher at: tcp://*:4500
 wait 1 sec .
port : 0
------------
link         :  link : Link Up - speed 10000 Mbps - full-duplex
promiscuous  : 0
port : 1
------------
link         :  link : Link Up - speed 10000 Mbps - full-duplex
promiscuous  : 0
 number of ports         : 2
 max cores for 2 ports   : 1
 tx queues per port      : 3
 -------------------------------
RX core uses TX queue number 2 on all ports
 core, c-port, c-queue, s-port, s-queue, lat-queue
 ------------------------------------------
 1        0      0       1       0      0
 -------------------------------


-Per port stats table
      ports |               0 |               1
 -----------------------------------------------------------------------------------------
   opackets |               0 |               0
     obytes |               0 |               0
   ipackets |               0 |               0
     ibytes |               0 |               0
    ierrors |               0 |               0
    oerrors |               0 |               0
      Tx Bw |       0.00  bps |       0.00  bps

-Global stats enabled
 Cpu Utilization : 0.0  %
 Platform_factor : 1.0
 Total-Tx        :       0.00  bps
 Total-Rx        :       0.00  bps
 Total-PPS       :       0.00  pps
 Total-CPS       :       0.00  cps

 Expected-PPS    :       0.00  pps
 Expected-CPS    :       0.00  cps
 Expected-L7-BPS :       0.00  bps

 Active-flows    :        0  Clients :        0   Socket-util : 0.0000 %
 Open-flows      :        0  Servers :        0   Socket :        0 Socket/Clients :  -nan
 drop-rate       :       0.00  bps
 current time    : 2.8 sec
 test duration   : 0.0 sec

 ##
 ## 이 터미널은 계속 출력용으로 사용되고, 사용자 입력을 받을 수 없다.
 ##
위에서 사용한 astf/http_simple.py 스크립트 외에 내가 테스트하면서 유용하다고 생각했던 스크립트들을 열거하면 아래와 같다.
##
## 서로 다른 내용의 여러 개 PCAP을 동시에 Play할 때는 아래 스크립트를 사용한다.
##
trex>  start  -f astf/http_by_l7_percent.py  -m 100  -d 30
... 출력 내용 생략 ...


##
## Interative mode의 CLI가 아닌 경우도 지원한다.
##
$ ./t-rex-64 --astf -f astf/http_simple_cc.py   -m 300mbps  -d 30
Stateful Networking Test (UDP Request & Response)
TCP/HTTP 테스트랑 터미널 구성이나 CLI 명령 입력이 비슷하기 때문에 [ Terminal B ]에 입력하는 내용만 설명하겠다.
[ Terminal B - 사용자 명령 입력용 ]
##
## UDP로 1개의 요청 메시지를 보내고, 1개의 응답 메시지를 받는 경우.
##
trex>  start  -f astf/udp1.py  -m 10000  -d 30


##
## SIP/UDP 요청 메시지를 보내고, 응답 메시지를 받는 경우.
##
trex>  start  -f astf/udp_sip.py  -m 1000000  -d 5


##
## DNS/UDP 요청 메시지를 보내고, 응답 메시지를 받는 경우.
##
trex>  start  -f astf/udp_topo_traffic.py  -m 30000  -d 10
Stateless Networking Test (UDP One-Way Direction)
단방향으로 UDP 패킷만 보내는 경우에는 아래와 같이 명령을 수행한다. (Spirent C1 계측기와 유사한 동작)
[ Terminal A - TRex 서버 프로그램 구동용 ]
$  ./t-rex-64 -i --stl --no-scapy-server

... 출력 내용 생략 ...
[ Terminal B - 사용자 명령 입력용 ]
$  ./trex-console

trex>  portattr -a --prom on
... 출력 내용 생략 ...


trex>  stats --ps
... 출력 내용 생략 ...


trex>  start -f stl/udp_1pkt_src_ip_split.py  -m 9809mbps -d 15
... 출력 내용 생략 ...


trex>  start -f stl/bench.py -m 10kbps -d 5
... 출력 내용 생략 ...


trex>  start -f stl/udp_multi_simple_list_test.py -m 10kbps -d 5
... 출력 내용 생략 ...


trex>  start -f stl/udp_1pkt_simple.py -m 10kbps -d 5
... 출력 내용 생략 ...


trex>  streams -a
... 출력 내용 생략 ...
Concurrent Connection Test (CC 테스트, 동시 접속 과부하 테스트)
HTTP 세션이 오래 유지되도록 하면서 서버 장비 또는 L4 ~ L7 Network 장비의 Memory 부하를 끌어올리는 테스트를 하고자 한다면,
아래의 설정과 명령을 따라 수행하면 된다.
(테스트 절차가 위에서 했던 테스트와 비슷하므로 자세한 설명은 생략한다.)
우선 TRex 설정 값부터 조정해야 한다.
trex_cfg.yaml 파일에서 dp_flows 항목의 값을 적당히 높여준다.
물론 TRex가 돌아가는 장비(HW)의 Memory가 충분한지 먼저 확인하고 적절하게 값을 높여서 설정한다.
$  vim  /etc/trex_cfg.yaml
- version: 2
  memroy:
    ## 30GB --> 15,000,000 flows  (이 값을 참고하여 필요한 만큼 값을 올린다)
    dp_flows: 15000000
... 중간 생략 ...

$  cd $TREX_ROOT
$  ./t-rex-64  -i  --astf
그리고 아래와 같이 python 스크립트를 수행한다.
$  ./trex-console

trex> start  -f astf/http_high_active_flows.py  -m 1000  -t delay=10000000

## 유용한 옵션 값을 제시하면 아래와 같다.
##   아래 옵션으로 실행하면,
##     CC  : 500,000 ~ 550,000
##     CPS : 40,000
##     BPS : 300Mbps
##     CPU : 50%
tui> start  -f astf/http_high_active_flows.py  -m 50000  -t delay=10000000


##   아래 옵션으로 실행하면,
##     CC  : 1,000,000    # 위 명령보다 delay를 2배 늘리면, CC도 2배 늘어난다.
##     CPS : 40,000
##     BPS : 320Mbps
##     CPU : 50%
tui> start  -f astf/http_high_active_flows.py  -m 50000  -t delay=20000000
참고: -m 옵션의 값을 처음에는 작게 설정해서 테스트하고, 테스트 결과를 보면서 -m 옵션 값을 2~10배씩 올려가면서 테스트한다.
Ceph를 실행할 때 Linux 커널에 대한 튜닝 고려 사항 (redhat 문서) https://access.redhat.com/documentation/ko-kr/red_hat_ceph_storage/5/html/object_gateway_guide/tuning-considerations-for-the-linux-kernel-when-running-ceph_rgw
MariaDB + Ceph 조합으로 성능 테스트한 블로그 참고 - https://ablog.jc-lab.net/230
[ 테스트 여담 ] 처음 Ceph cluster를 구축할 때, Storage로 HDD를 사용했었다. 그러다가 1개월 후에 SSD로 변경했는데 Bandwidth는 미미하게 커졌고, IOPS 값이 많이 상승했다. mariaDB 처럼 OS Cache 사용을 원천적으로 막은 DB 제품은 Transaction이 빈번하게 발생하는데, 이런 경우 SSD를 사용하면 엄청나게 큰 효과를 볼 수 있다. 반면 큰 파일을 write, read 하는 Use case라면, ceph storage로 HDD를 사용하든 SSD를 사용하든 성능 면에서 큰 차이는 없다.
InnoDB(MariaDB, MySQL) System Variables 전체 목록 및 상세 설명 문서 - https://mariadb.com/kb/en/innodb-system-variables/
DB 관리 목적의 SQL (예: show, backup, analyze, kill, reset, use) - https://mariadb.com/kb/en/administrative-sql-statements/
자세한 설명을 하기 전에 설정 파일 예제부터 보자.
$ cat /etc/mysql/conf.d/mariadb.cnf

[client-server]
port = 3306
socket = /run/mysqld/mysqld.sock

[mariadbd]
server-id = 1
bind-address = 0.0.0.0
lower_case_table_names = 1

... 중간 생략 ...

##
## NOTE: 성능 테스트를 위해 아래 4개 항목을 변경하면서 Query Per Second를 측정해봤다.
##
innodb_flush_log_at_trx_commit = 0
innodb_flush_method = O_DIRECT_NO_FSYNC
innodb_flush_sync = OFF
innodb_use_native_aio = OFF

... 중간 생략 ...

$
Transaction Commit Log에 대한 Flush 여부 설정
설정 항목: innodb_flush_log_at_trx_commit
##
##  innodb_flush_log_at_trx_commit 설정 변경
##


MariaDB [(none)]> show variables like '%innodb_flush_log_at%';
+--------------------------------+-------+
| Variable_name                  | Value |
+--------------------------------+-------+
| innodb_flush_log_at_timeout    | 1    |
| innodb_flush_log_at_trx_commit | 0     |
+--------------------------------+-------+
2 rows in set (0.001 sec)

MariaDB [(none)]> set global innodb_flush_log_at_trx_commit=0;
Query OK, 0 rows affected (0.000 sec)

MariaDB [(none)]>  show variables like 'innodb_flush_log_at_trx_commit';
+--------------------------------+-------+
| Variable_name                  | Value |
+--------------------------------+-------+
| innodb_flush_log_at_trx_commit | 0     |
+--------------------------------+-------+
1 row in set (0.000 sec)

MariaDB [(none)]>
위 설정 관련 참고 문서: innodb_flush_log_at_trx_commit 개념 그림 및 튜닝 https://yunhyeonglee.tistory.com/41
############################################################################
## 쓰기(output) 성능 확인
############################################################################

## Case: 저장 장치의 Cache memory(즉, Buffer memory)를 사용하는 경우
$ dd if=/dev/zero bs=1024 count=5000 of=/mnt/hdd1/my_test_file
5000+0 records in
5000+0 records out
5120000 bytes (5.1 MB, 4.9 MiB) copied, 0.0113672 s, 450 MB/s
$

## Case: 저장 장치의 Cache memory(즉, Buffer memory)를 사용하지 않는 경우,
##       oflag=direct  옵션을 추가한다.
$ dd if=/dev/zero bs=1024 count=5000 of=/mnt/hdd1/my_test_file oflag=direct
5000+0 records in
5000+0 records out
5120000 bytes (5.1 MB, 4.9 MiB) copied, 0.23691 s, 21.6 MB/s


############################################################################
## 읽기(input) 성능 확인
############################################################################

$ dd if=/mnt/hdd1/my_test_file of=/dev/null bs=1024
5000+0 records in
5000+0 records out
5120000 bytes (5.1 MB, 4.9 MiB) copied, 0.0123259 s, 415 MB/s
$