준비 작업: Elastic 8.0 및 Kibana 설치하기
아래 김종민 님의 설명을 읽고, Elasticsearch 및 Kibana 설치하는 것이 제일 쉽고 간단하다.
Elastic 8.0 설치하기 - Jongmin's Lifelog
정말 오랬만에 블로그 포스팅을 하네요. 얼마 전에 드디어 Elastic 8.0 이 출시되었습니다. 6.x 릴리스 까지는 보통 1년 ~ 18개월 정도의 텀을 두고 비교적 빠르게 버전 업데이트를 했는데 7.x 릴리스
kimjmin.net
##
## Elasticsearch 기동하기
##

$  bin/elasticsearch


##
## Kibana 기동하기
##   주의: 명령 옵션으로 --host를 지정하지 않으면, 기본값이 127.0.0.1로 설정된다.
##        만약 Web Browser가 kibana 서버와 다른 곳에 있다면 반드시 아래와 같이
##        외부에서 접근 가능한 서버 주소를 지정해주어야 한다.

$ bin/kibana  --host=192.168.0.11
Elasticsearch 서버와 Kibana 서버를 설치했으면, 아래의 문서를 보면서 Python Example App을 작성한다.
Elasticsearch Python Client Example
2022년 11월 현재, 아래의 Web Docs가 가장 쉽게 설명된 것 같다.
Python PKG 설치, 인증/연결, 설정, Client Example Code 등 필요한 내용을 다 포함하고 있다.
Elasticsearch Python Client [8.5] | Elastic
www.elastic.co
아래 Docs는 초반에 "Elastic Cloud"를 먼저 예시로 설명하고 있는데,
만약 Private 환경(즉, self-managed cluster)에서 Client Example을 테스트할 것이라면
이 Docs의 아래 부분만 읽으면 된다.
[ 즉, 바로 이 부분부터 읽고 따라하면 된다 ]
https://www.elastic.co/guide/en/elasticsearch/client/python-api/master/connecting.html#connect-self-managed-new
Connecting | Elasticsearch Python Client [master] | Elastic
The async client shouldn’t be used within Function-as-a-Service as a new event loop must be started for each invocation. Instead the synchronous Elasticsearch client is recommended.
www.elastic.co
CRUD(Create, Read, Update, Delete) 예제를 보고 싶다면, 아래 Web Docs를 열람.
https://www.elastic.co/guide/en/elasticsearch/client/python-api/current/examples.html
Examples | Elasticsearch Python Client [8.5] | Elastic
Below you can find examples of how to use the most frequently called APIs with the Python client. Indexing a documentedit To index a document, you need to specify three pieces of information: index, id, and a body: from datetime import datetime from elasti
www.elastic.co
실제로 위 Web Docs를 보고 조금 변경해서 작성해본 예시이다.
그냥 Copy & Paste해서 `python3 myexample.py` 명령을 수행하면 된다.
Document 1개를 Elasticsearch에 저장하는 예제
from datetime import datetime
from elasticsearch import Elasticsearch

##
## NOTE : Configuration for multi node
##
NODES = [ "https://10.1.3.166:9200" ]

##
## Password for the 'elastic' user generated by Elasticsearch
##
ELASTIC_PASSWORD = "mypasswd"

##
## Create the client instance
##
es = Elasticsearch(
    NODES,
    ca_certs="/MyWorkSpace/elastic-stack-metal-install/elasticsearch-8.5.1/config/certs/http_ca.crt",
    basic_auth=("elastic", ELASTIC_PASSWORD)
)

## Create documents
doc = {
    'my-key-example-a': 'my-value-1',
    'my-key-example-b': 'my-value-2',
    'date': datetime.now(),
    'msg': "my log message example... hello~  world ^^",
}

resp = es.index(index="example-index-0", id=0, document=doc)
print(resp['result'])
Bulk로 많은 Document를 Elasticsearch에 저장하는 예제
from datetime import datetime
from elasticsearch import Elasticsearch
from randmac import RandMac


NODES = [ "https://10.1.3.166:9200" ]

##
## Password for the 'elastic' user generated by Elasticsearch
##
ELASTIC_PASSWORD = "mypasswd"

##
## Create the client instance
##
es = Elasticsearch(
    NODES,
    ca_certs="/MyWorkSpace/elastic-stack-metal-install/elasticsearch-8.5.1/config/certs/http_ca.crt",
    basic_auth=("elastic", ELASTIC_PASSWORD)
)

doc_id = 0
loop_cnt = 0

##
## Create documents
##
##   참고: 아래 for 문은 document 예시를 그럴듯하게 만들기 위함이다.
##        실제 Elasticsearch와는 아무런 관련이 없다. ^^
ip_networks = ["10", "172", "192"]

for ii in ip_networks:
    for xx in range(254):
        for yy in range(254):
            for zz in range(254):
                macaddress = str(RandMac())
                doc = {
                    'app': 'nac-server',
                    'level': 'info',
                    'date': datetime.now(),
                    'ip-address': ii + '.' + str(xx) + '.' +  str(yy) + '.' + str(zz),
                    'mac-address': macaddress,
                    'msg': 'Device ' + macaddress + ' is started',
                }

                doc_id += 1
                loop_cnt += 1
                resp = es.index(index="example-index-0", id=doc_id, document=doc)
            print("Count: " + str(loop_cnt) + "   " + str(resp['_index']) + "   " + str(resp['_id']) + "   " + str(resp['result']) + "   shard:" + str(resp['_shards']) + "   " + str(resp['_seq_no']))

print("\nTotal Document: " + str(doc_id))
Document를 조회하기
from datetime import datetime
from elasticsearch import Elasticsearch

NODES = [ "https://10.1.3.166:9200" ]

# Password for the 'elastic' user generated by Elasticsearch
ELASTIC_PASSWORD = "mypasswd"

# Create the client instance
es = Elasticsearch(
    NODES,
    ca_certs="/MyWorkSpace/elastic-stack-metal-install/elasticsearch-8.5.1/config/certs/http_ca.crt",
    basic_auth=("elastic", ELASTIC_PASSWORD)
)

resp = es.get(index="test-index", id=5)
print(resp)
Kibana Web GUI로 결과 확인하기
Kibana Web GUI의 'dev tool'을 이용하여 아래와 같이 index, document를 조회할 수 있다.
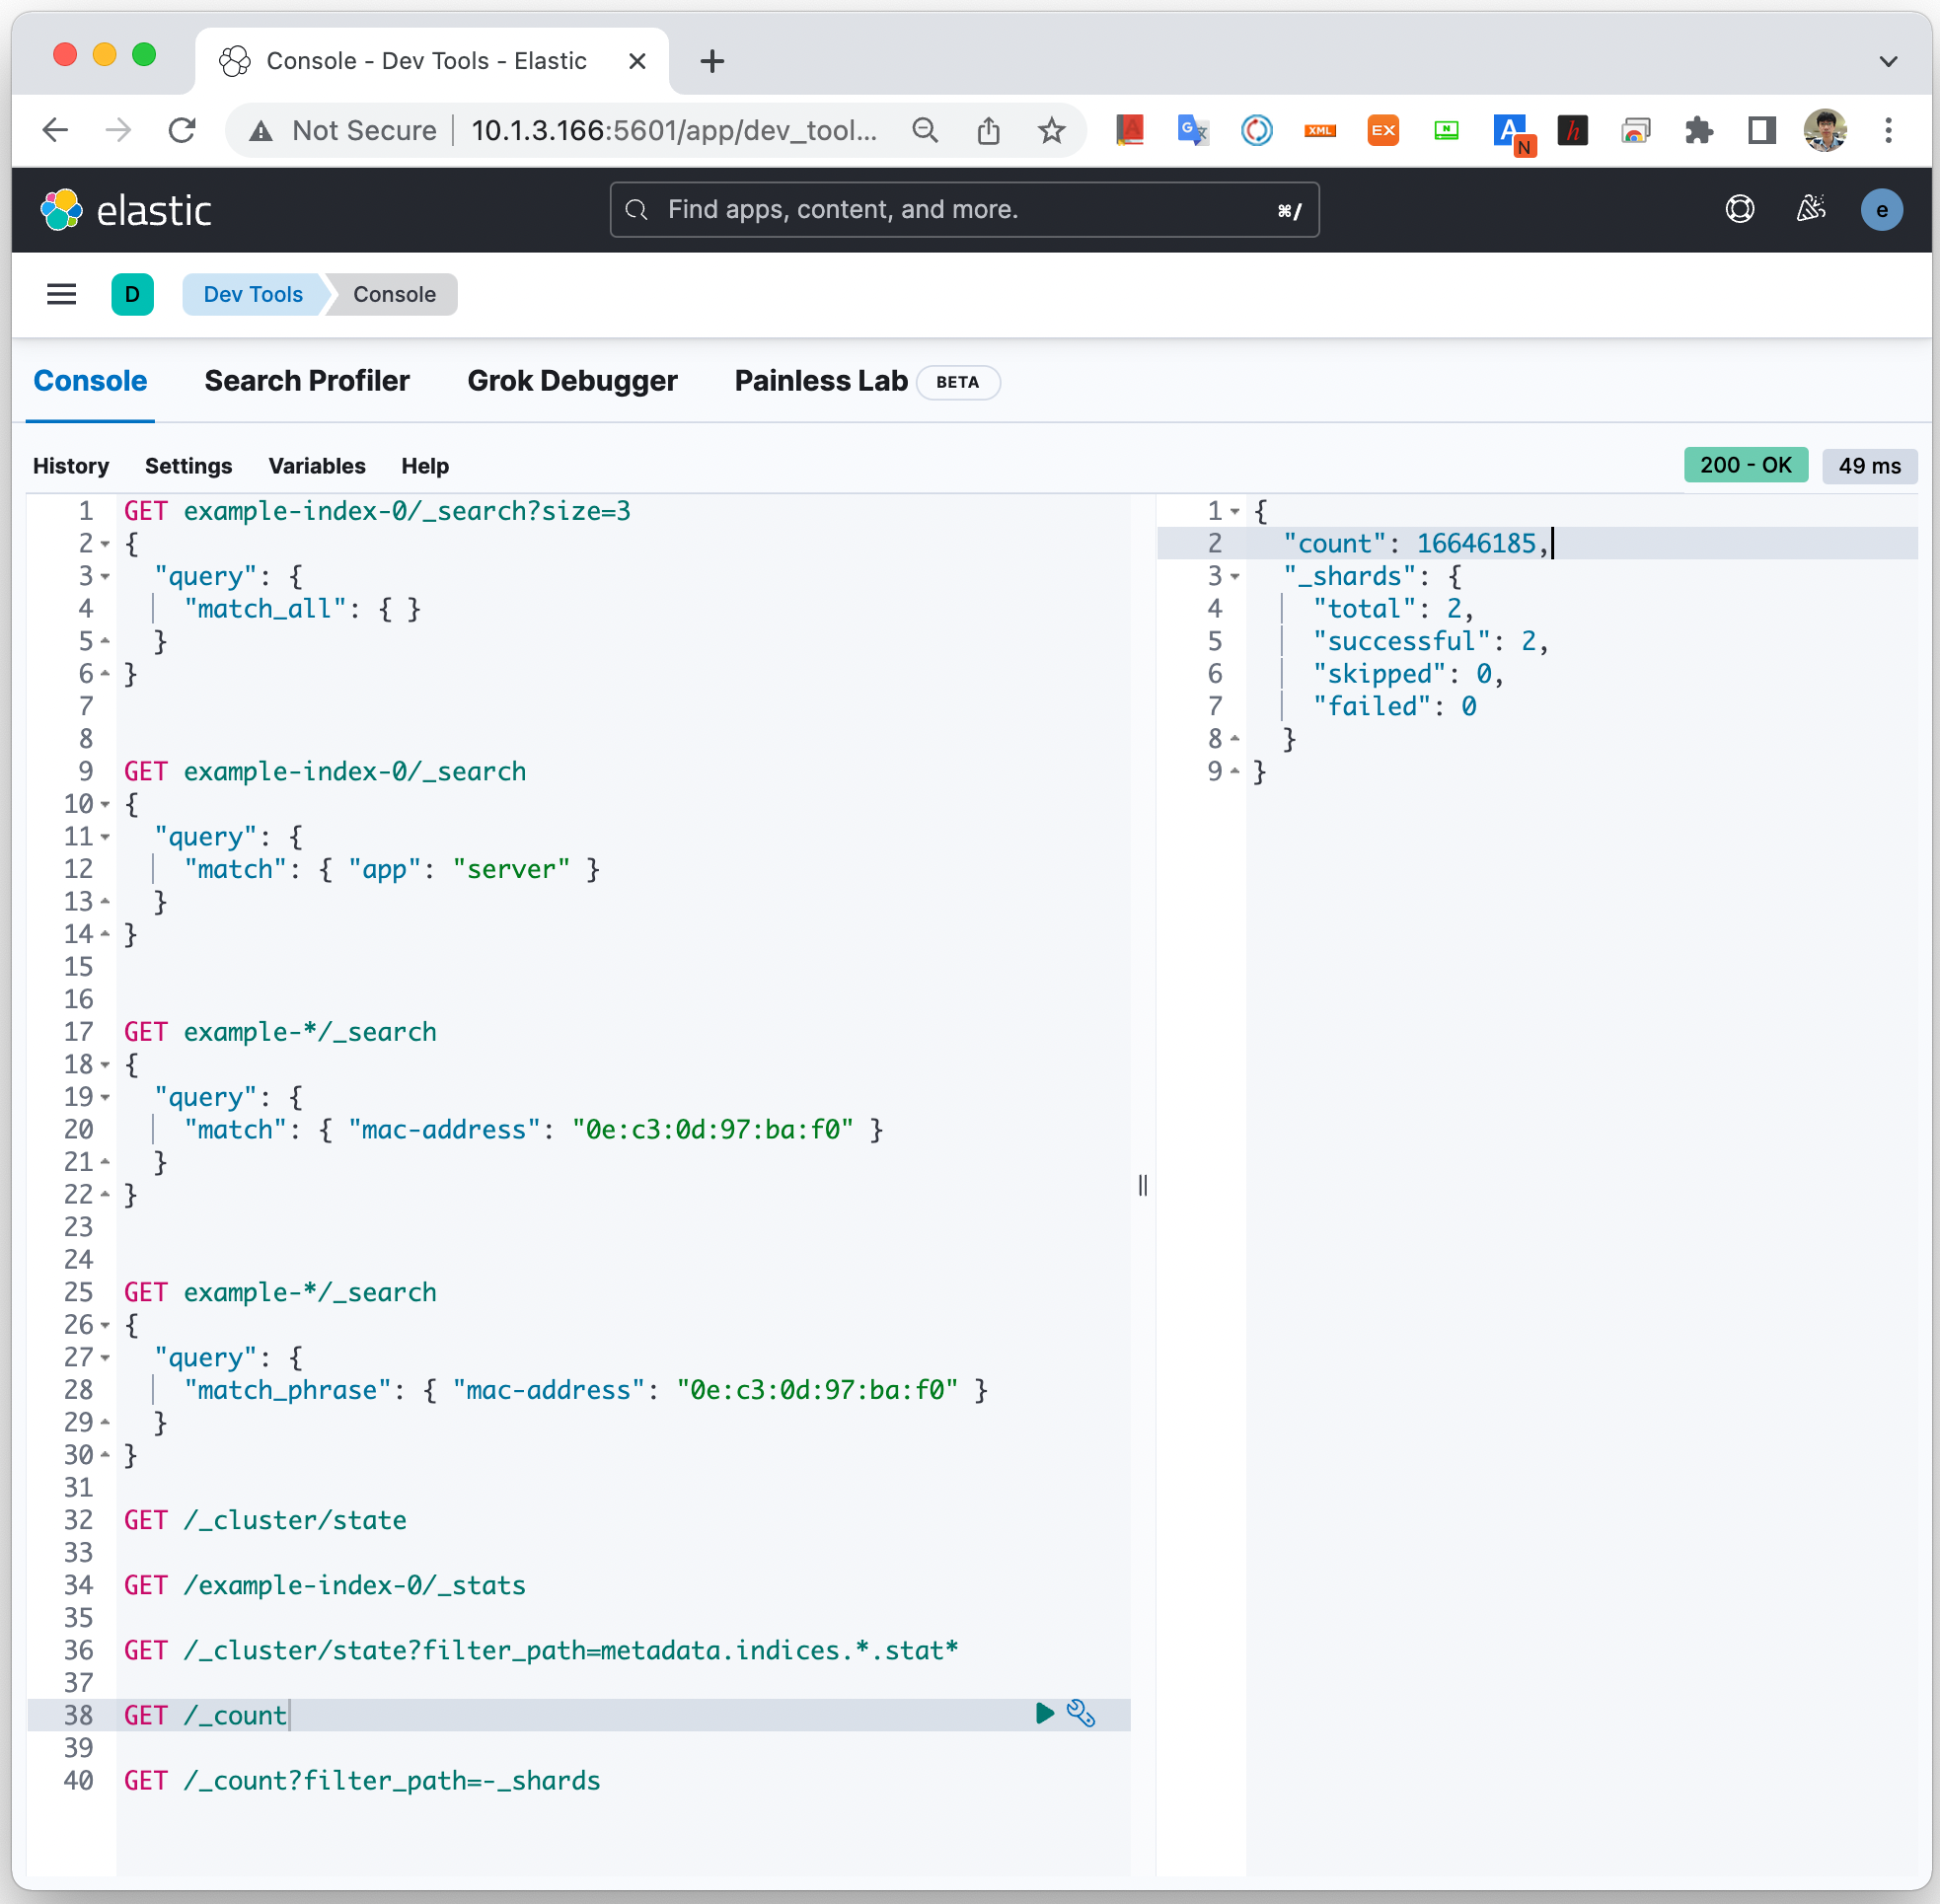
위 Web GUI에서 사용했던 Elasticsearch Query 참고.
##
## Index 정보를 가져온다.
##

GET _cat/indices?v

## 응답은 이런 모양이다.
health status index           uuid                   pri rep docs.count docs.deleted store.size pri.store.size
yellow open   example-index-0 Up1jqY3PTG2pLHdOLJcLGQ   1   1   18126912          739      2.9gb          2.9gb
yellow open   test-index      nGaLdNNORHKfJF1maBlNvw   1   1          2            0     11.2kb         11.2kb


##
## "example-index-0" 인덱스에 있는 모든 document 중에서 3개만 가져온다.
##

GET example-index-0/_search?size=3
{
  "query": {
    "match_all": { }
  }
}


##
## "app" 항목 중에서 "server"라는 어휘가 포함돠ㅣㄴ 문서를 모두 가져온다.
##

GET example-index-0/_search
{
  "query": {
    "match": { "app": "server" }
  }
}


##
## "mac-address" 항목 중에서 정확하게 "0e:c3:0d:97:ba:f0" 와 일치하는 document만 가져온다.
##

GET example-*/_search
{
  "query": {
    "match_phrase": { "mac-address": "0e:c3:0d:97:ba:f0" }
  }
}


##
## Elasticsearch Cluster 상태 정보를 가져온다.
##

GET /_cluster/state

GET /_cluster/state?filter_path=metadata.indices.*.stat*

GET /example-index-0/_stats


##
## Elasticsearch Cluster에 저장된 전체 Document 개수를 가져온다.
##

GET /_count


##
## 위 _count 정보 중에서 _shard 정보를 제외한 정보를 가져온다.
##

GET /_count?filter_path=-_shards
'IT General' 카테고리의 다른 글
| Block Chain, Bitcoin, Etherium 등 관련 URL 목록 (0) | 2022.12.19 |
|---|---|
| Block Chain(블록 체인), 스마트계약(Smart Contract), NTF 관련 자료 모음 (0) | 2022.11.30 |
| Geneve (Generic Network Virtualization Encapsulation) protocol vs VxLAN (0) | 2022.07.27 |
| Macbook UBS-C 4K 60Hz 출력을 HDMI 모니터에 연결하는 방법 (0) | 2022.07.20 |
| 파일, 블록, 오브젝트 스토리지 비교 (0) | 2022.07.19 |